TRACKWIZE — Productivity Intelligence
Building an intelligence layer for productivity without creating surveillance anxiety.

CONTEXT
Knowledge work today happens across multiple tools. Teams switch between browsers, documents, meetings and internal dashboards. Managers struggle to understand productivity without becoming intrusive.
The problem was not tracking activity.
The problem was creating clarity without creating surveillance anxiety.
Trackwize was built to bridge that gap.
DISCOVERY & INSIGHTS
We began by speaking with founders, team leads and remote employees across early stage startups.
We studied:
Daily work patterns
Tool switching behaviour
Manager reporting needs
Concerns around privacy
Three clear insights emerged.
1. Productivity is contextual, not time based.
Time spent does not equal meaningful output.
2. Teams fear surveillance.
Tracking tools create resistance when they feel controlling.
3. Managers want clarity, not micromanagement.
They want patterns, not raw logs.
The real challenge was behavioural trust.
REFRAMING THE PROBLEM
Initial idea:
Build a tracking tool that measures activity across tools.
Reframed problem:
How might we provide productivity intelligence without reducing user autonomy?
This reframing shaped every design decision.
PRODUCT STRATEGY
We designed Trackwize as an intelligence layer, not a monitoring dashboard.
Core components included:
• Context based activity clustering
• Focus session identification
• Distraction pattern insights
• Weekly summary intelligence
• Team level trend visibility
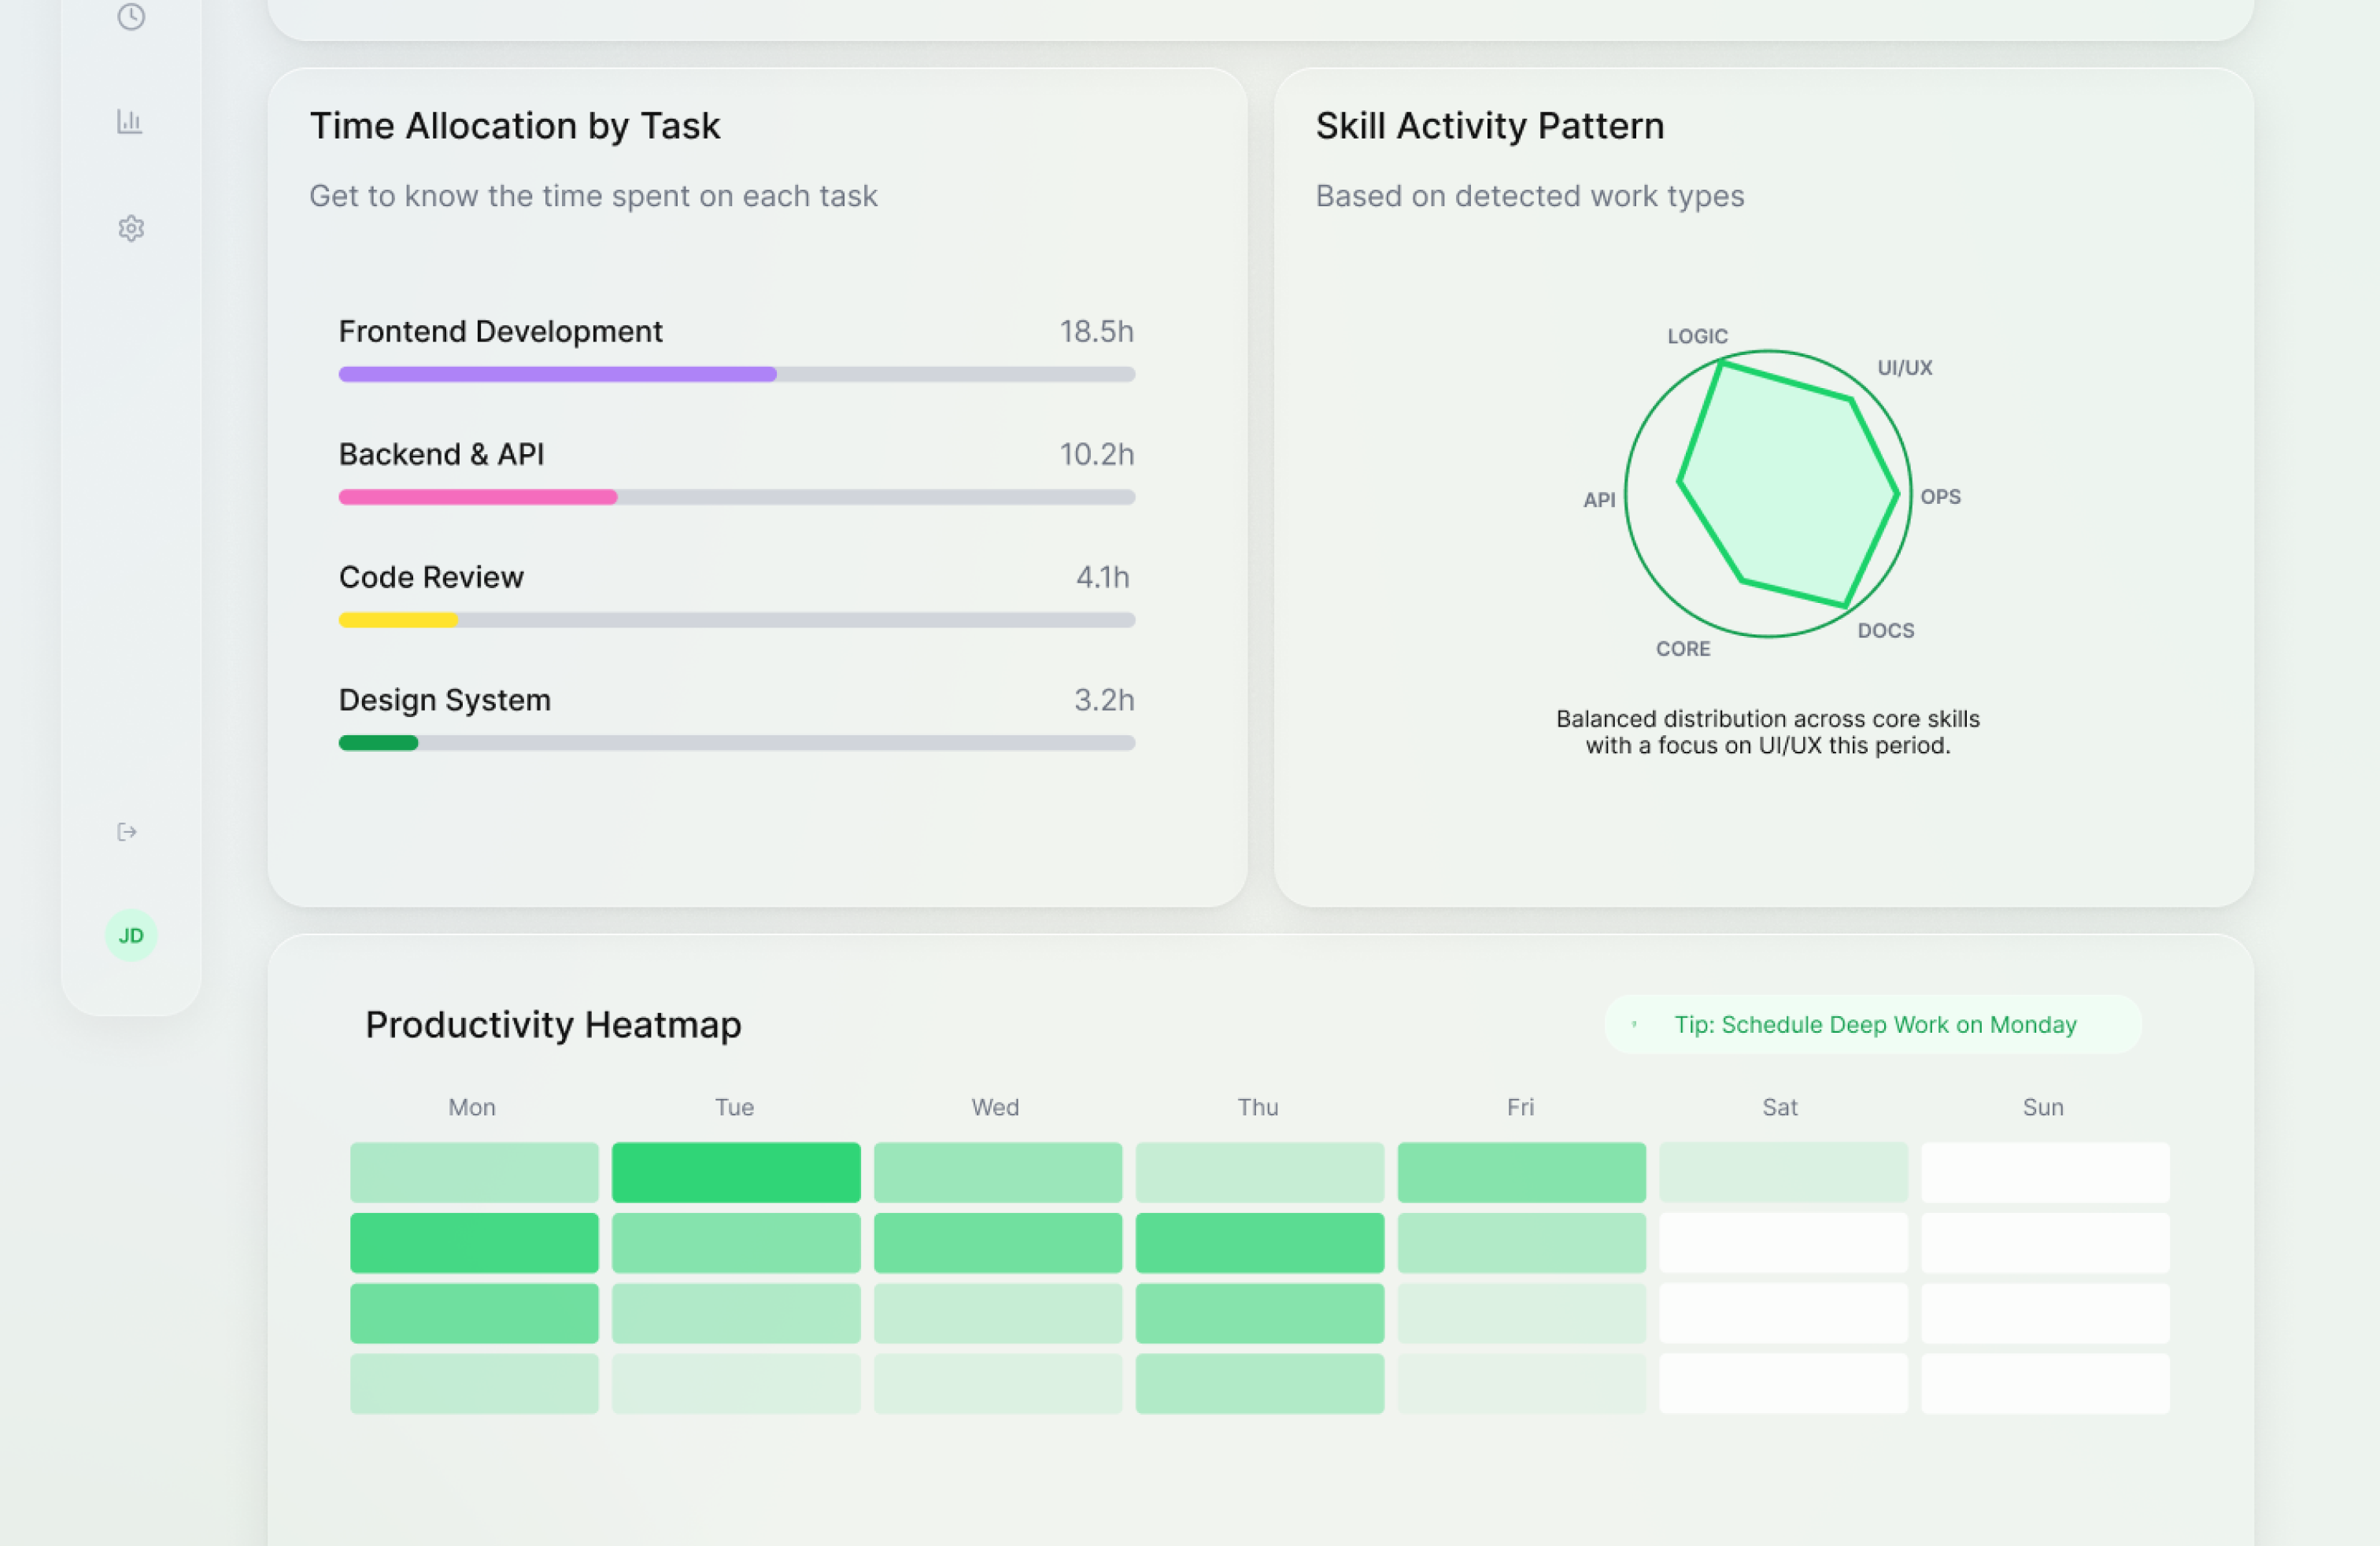
Instead of exposing raw activity logs, we surfaced behavioural patterns.
The goal was reflection, not control.
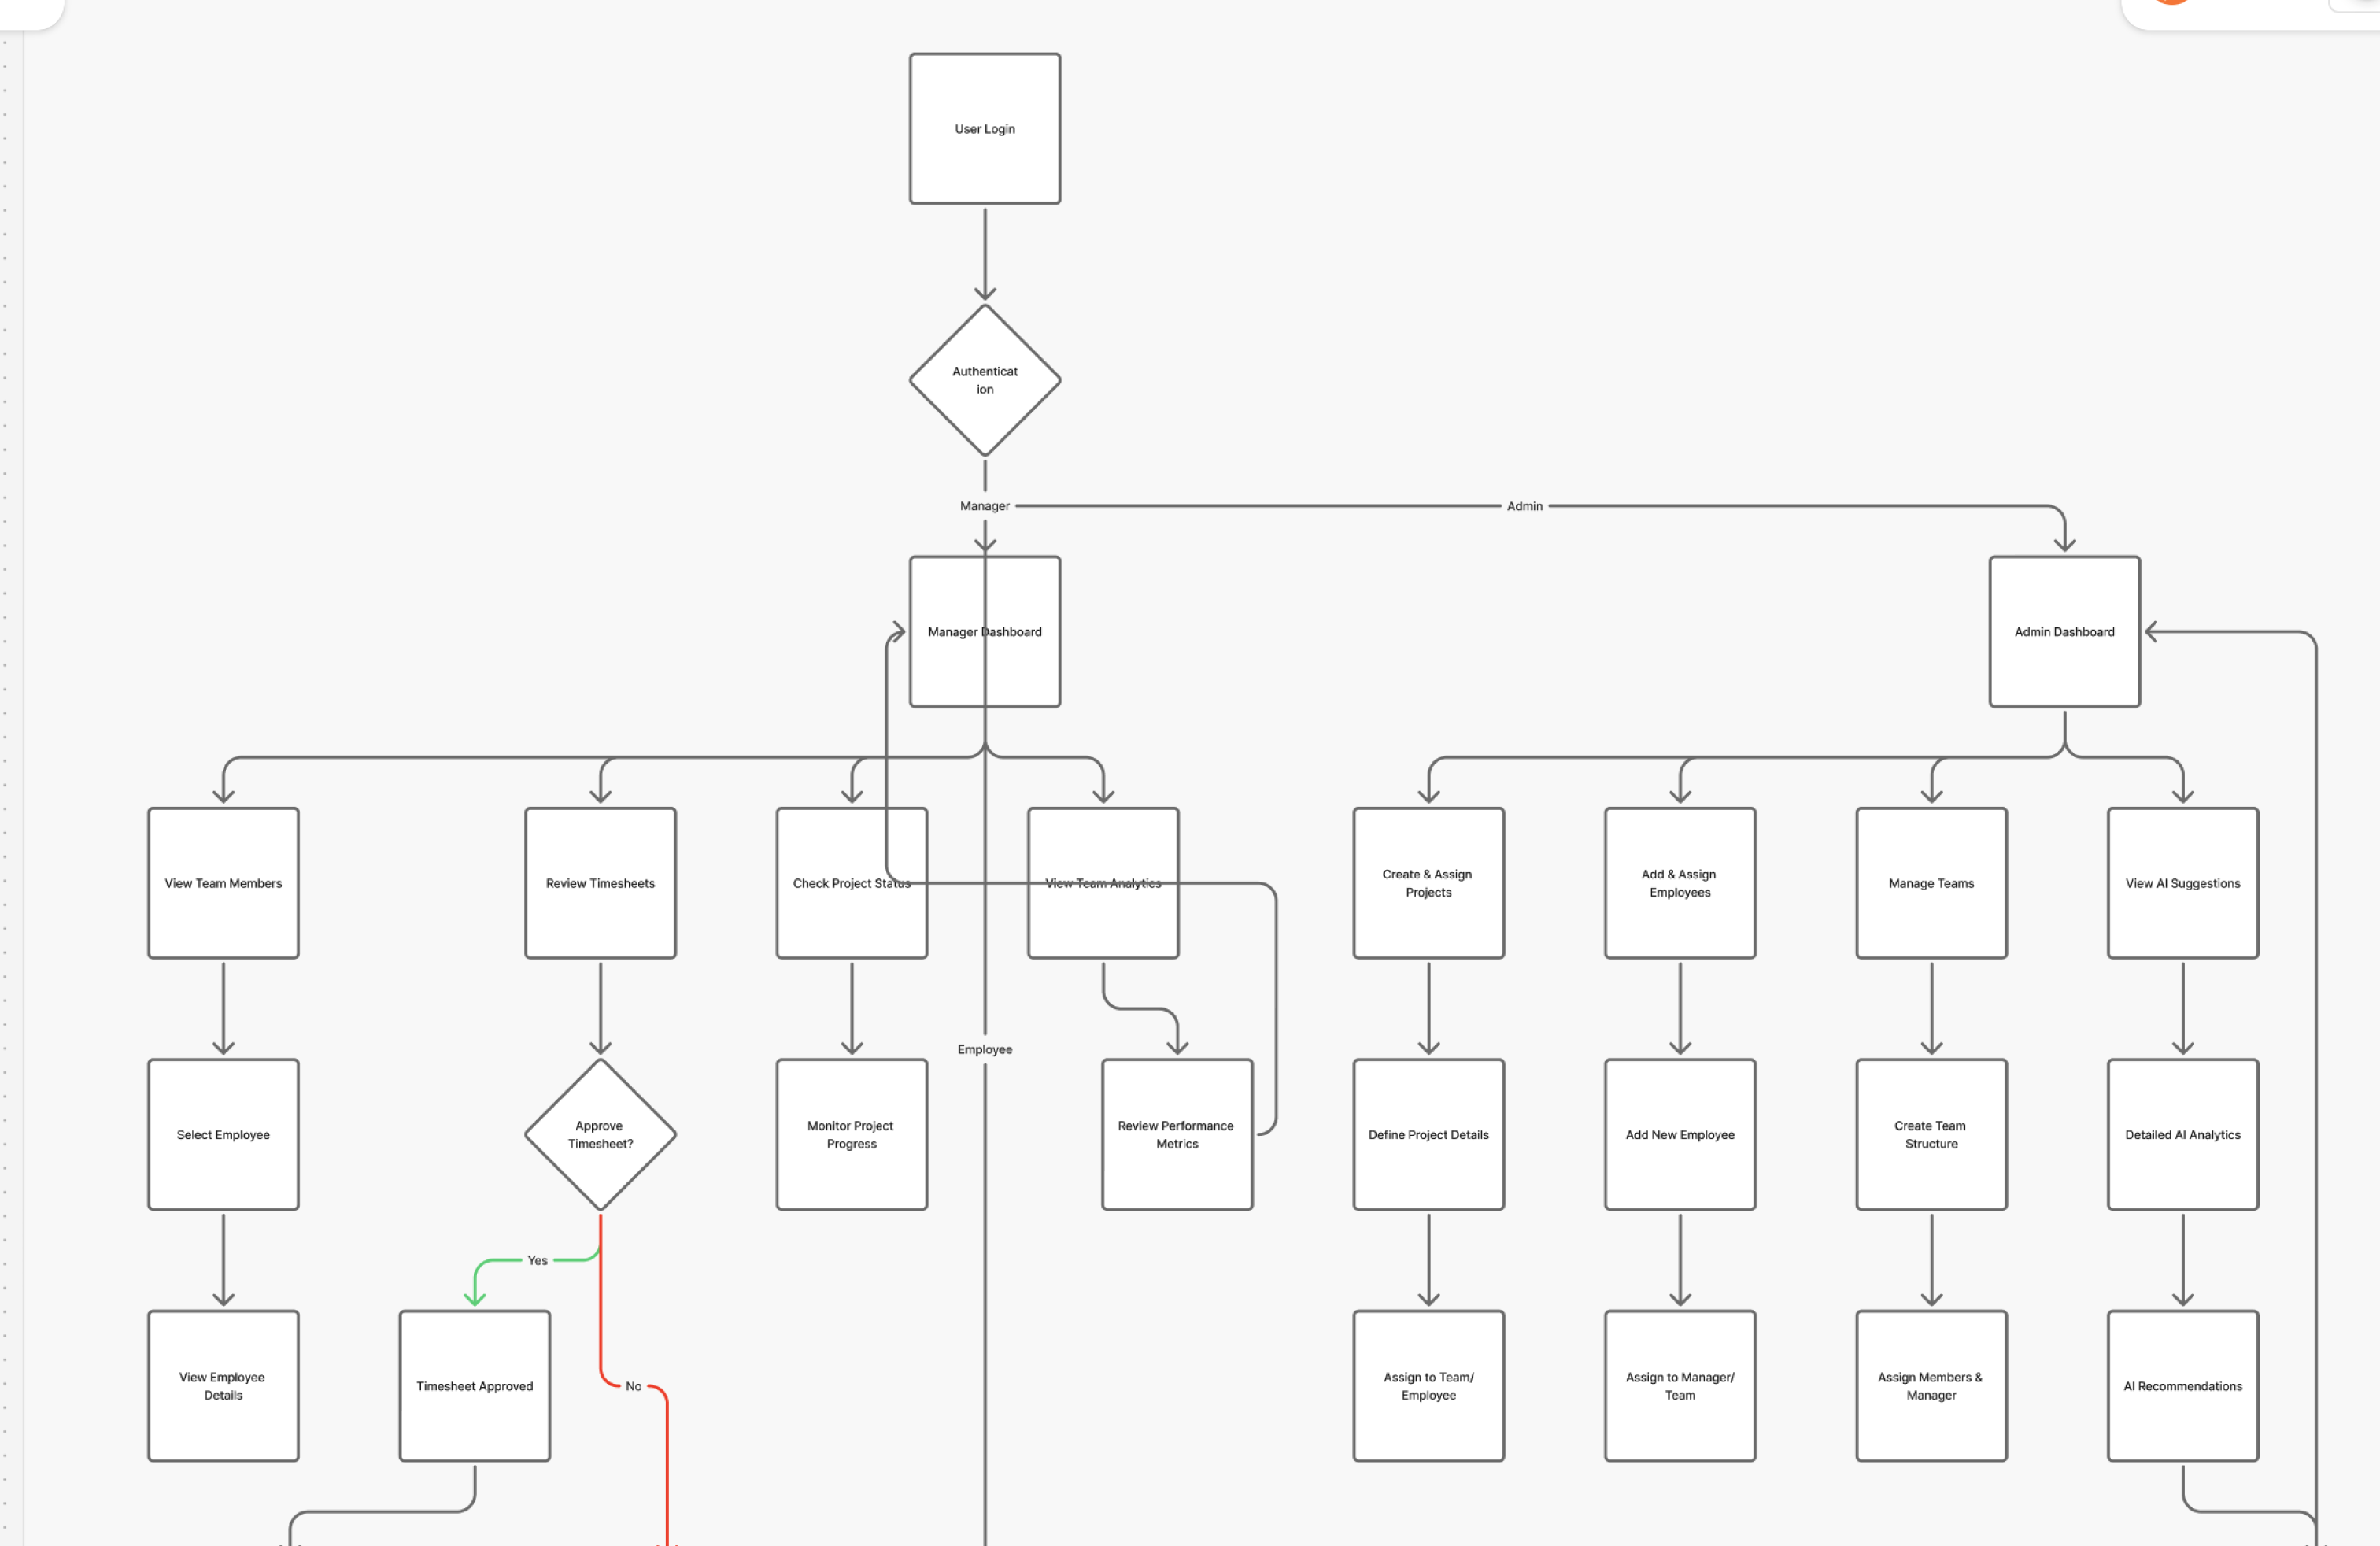
INFORMATION ARCHITECTURE
Productivity data can become overwhelming quickly.
We structured the IA into three layers:
• Individual view
• Manager view
• Organisation trends
Each layer showed:
Patterns first
Raw data second
This reduced cognitive overload and positioned insights as the primary output.
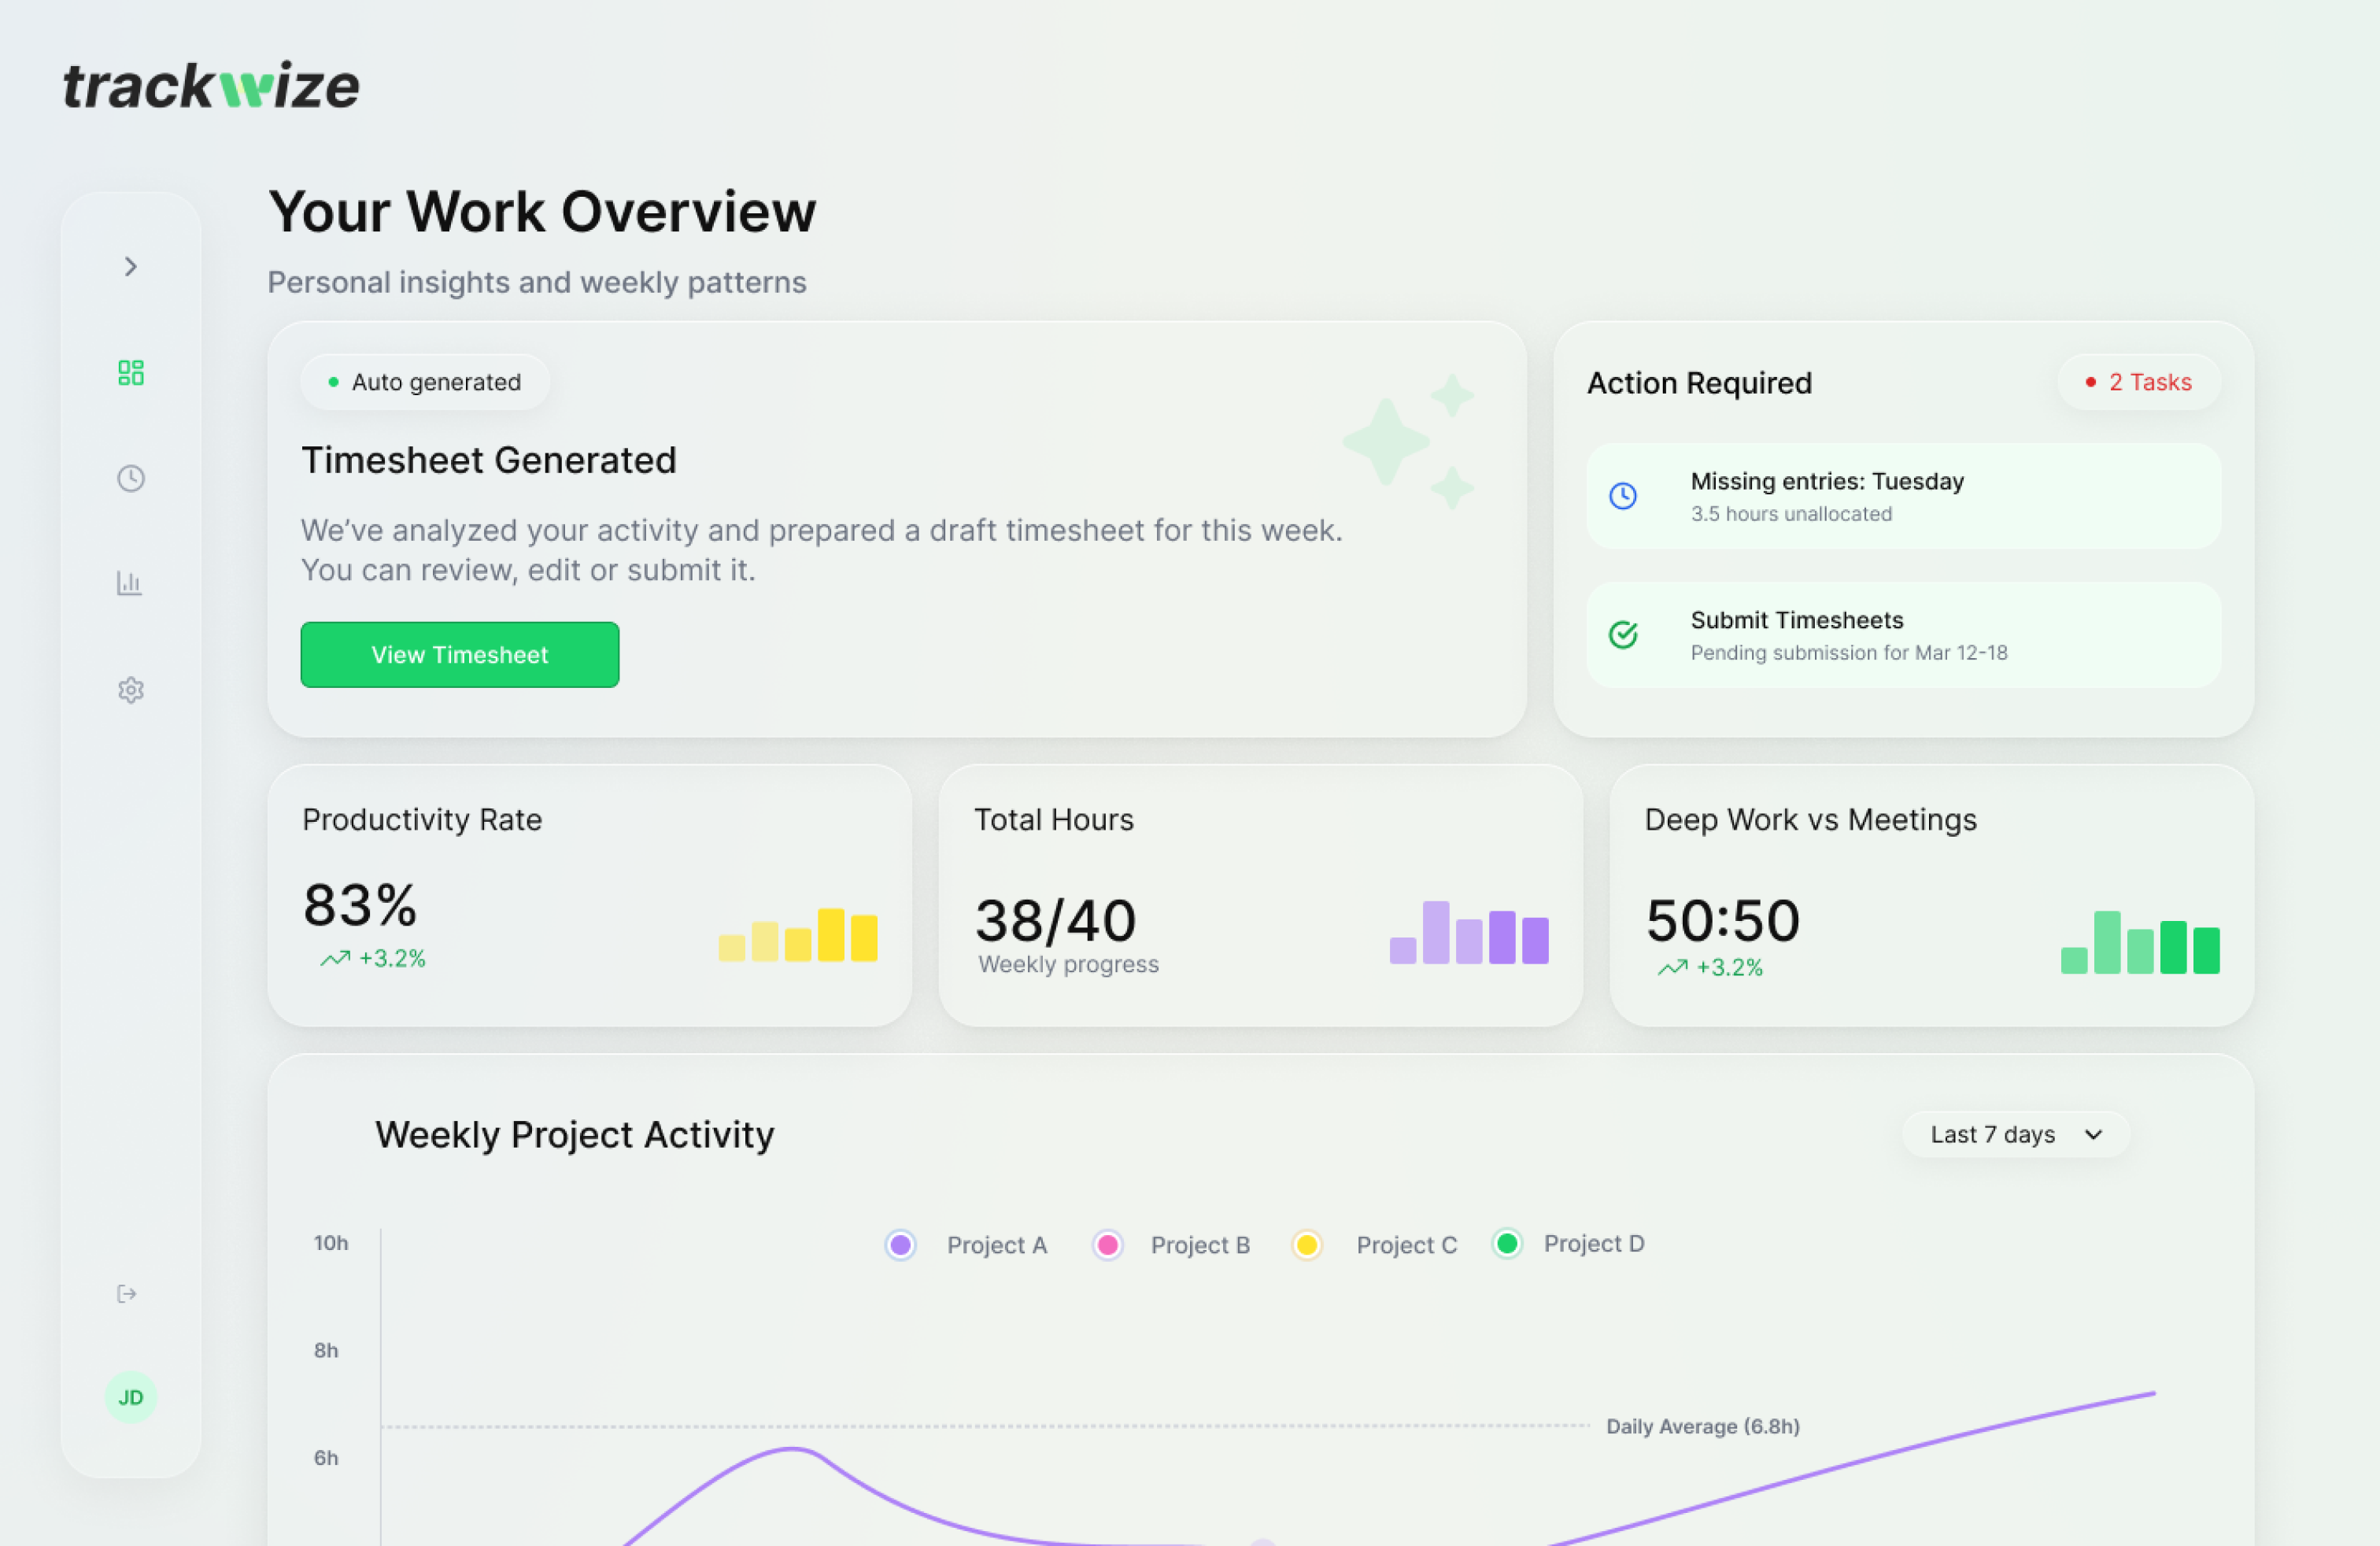
Dashboards were intentionally minimal, with clear visual grouping and limited metrics per screen.
SYSTEMS & IMPLEMENTATION
Design decisions focused on calm data presentation, non threatening language, clear privacy indicators, and actionable summaries.
For example:
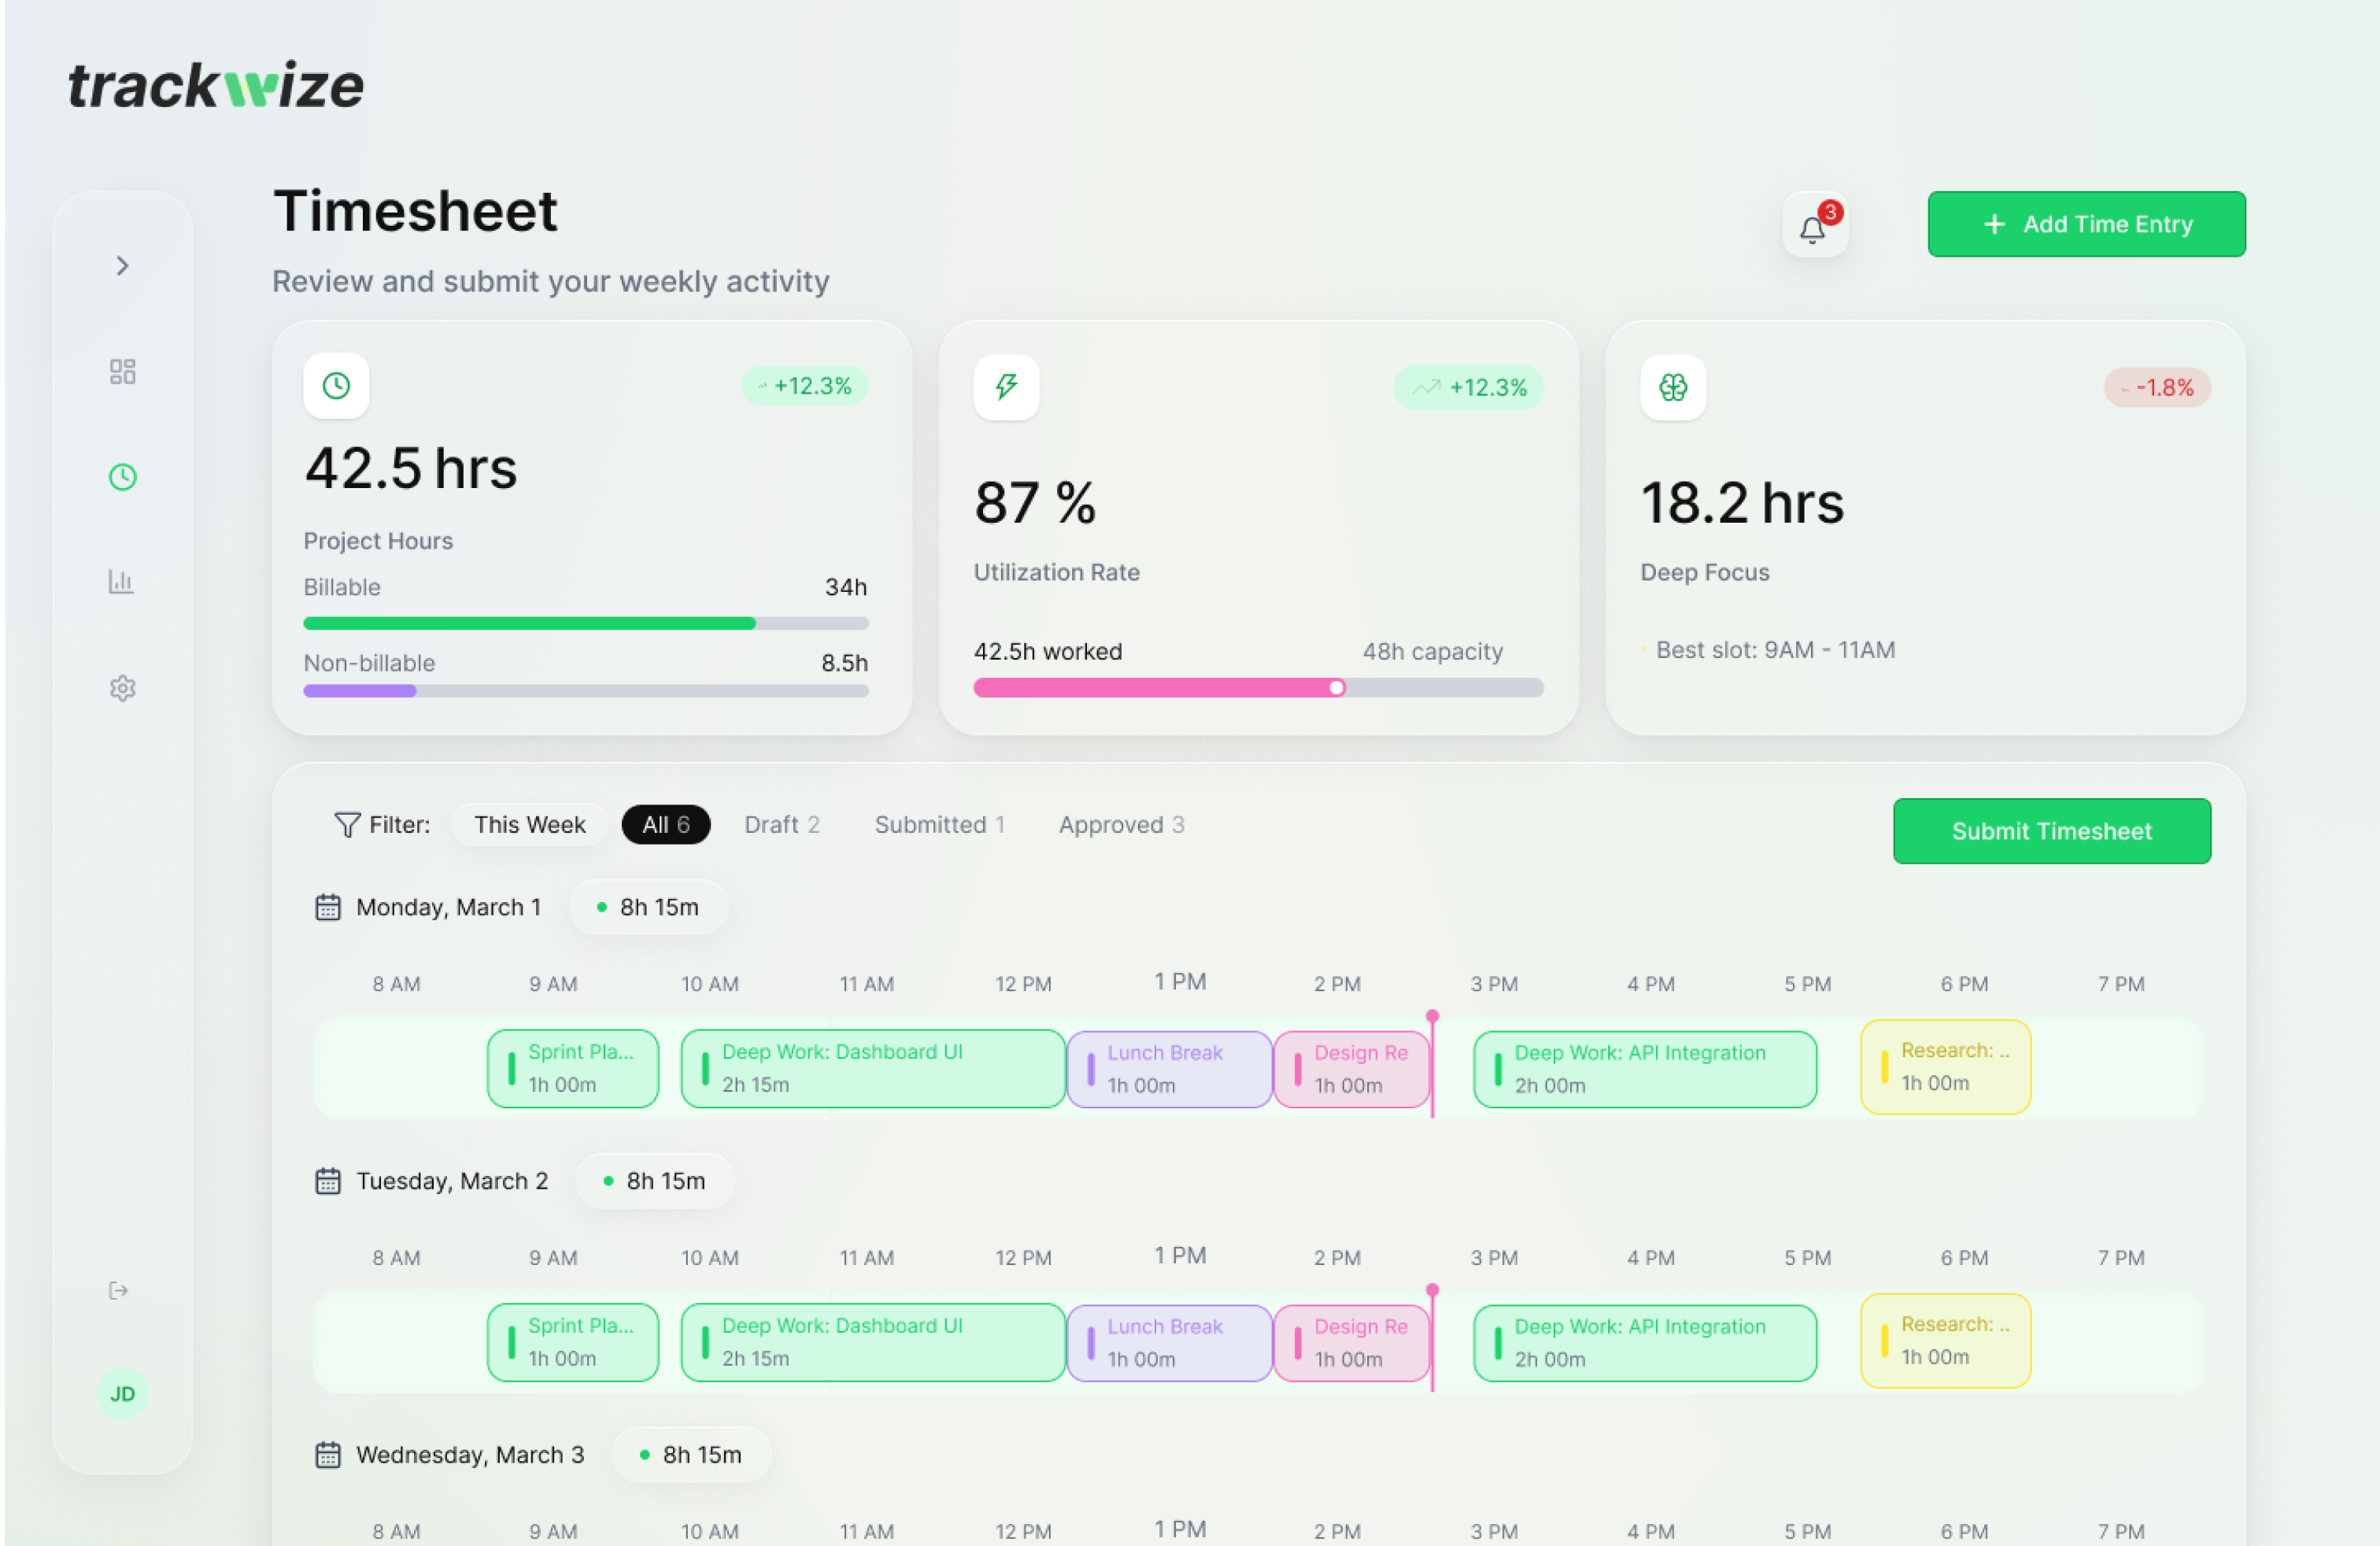
Instead of showing “Idle Time”, we framed it as “Context Switch Gaps”.
Language influences perception.
We avoided red alert patterns. No aggressive colour coding.
The system feels analytical, not judgmental.
I led frontend architecture and built a modular UI system aligned with backend event tracking structures.
Key design system decisions:
• Reusable analytics components
• Flexible chart containers
• Consistent filter logic
• Scalable dashboard layout
Performance was critical because the platform processed continuous background data. We optimised rendering and ensured lightweight interaction patterns.
VISUAL DESIGN
LEADERSHIP & COLLABORATION
I led:
• Discovery sessions
• Problem framing workshops
• UX direction
• Frontend implementation
• Engineering alignment
Worked closely with backend to ensure event data was structured meaningfully before reaching the interface.
This reduced noise at the design layer.
OUTCOMES
• Successfully launched MVP
• Validated productivity pattern model with early users
• Positive feedback on non intrusive experience
• Clear differentiation from surveillance style tools
The platform established a foundation for scaling into deeper productivity intelligence.
REFLECTION
This project reinforced an important lesson.
Data without context creates anxiety.
Insight with empathy creates clarity.
Designing behavioural intelligence tools requires careful framing, transparent systems and respect for user autonomy.
Trackwize was not about measuring people.
It was about helping them understand how they work.